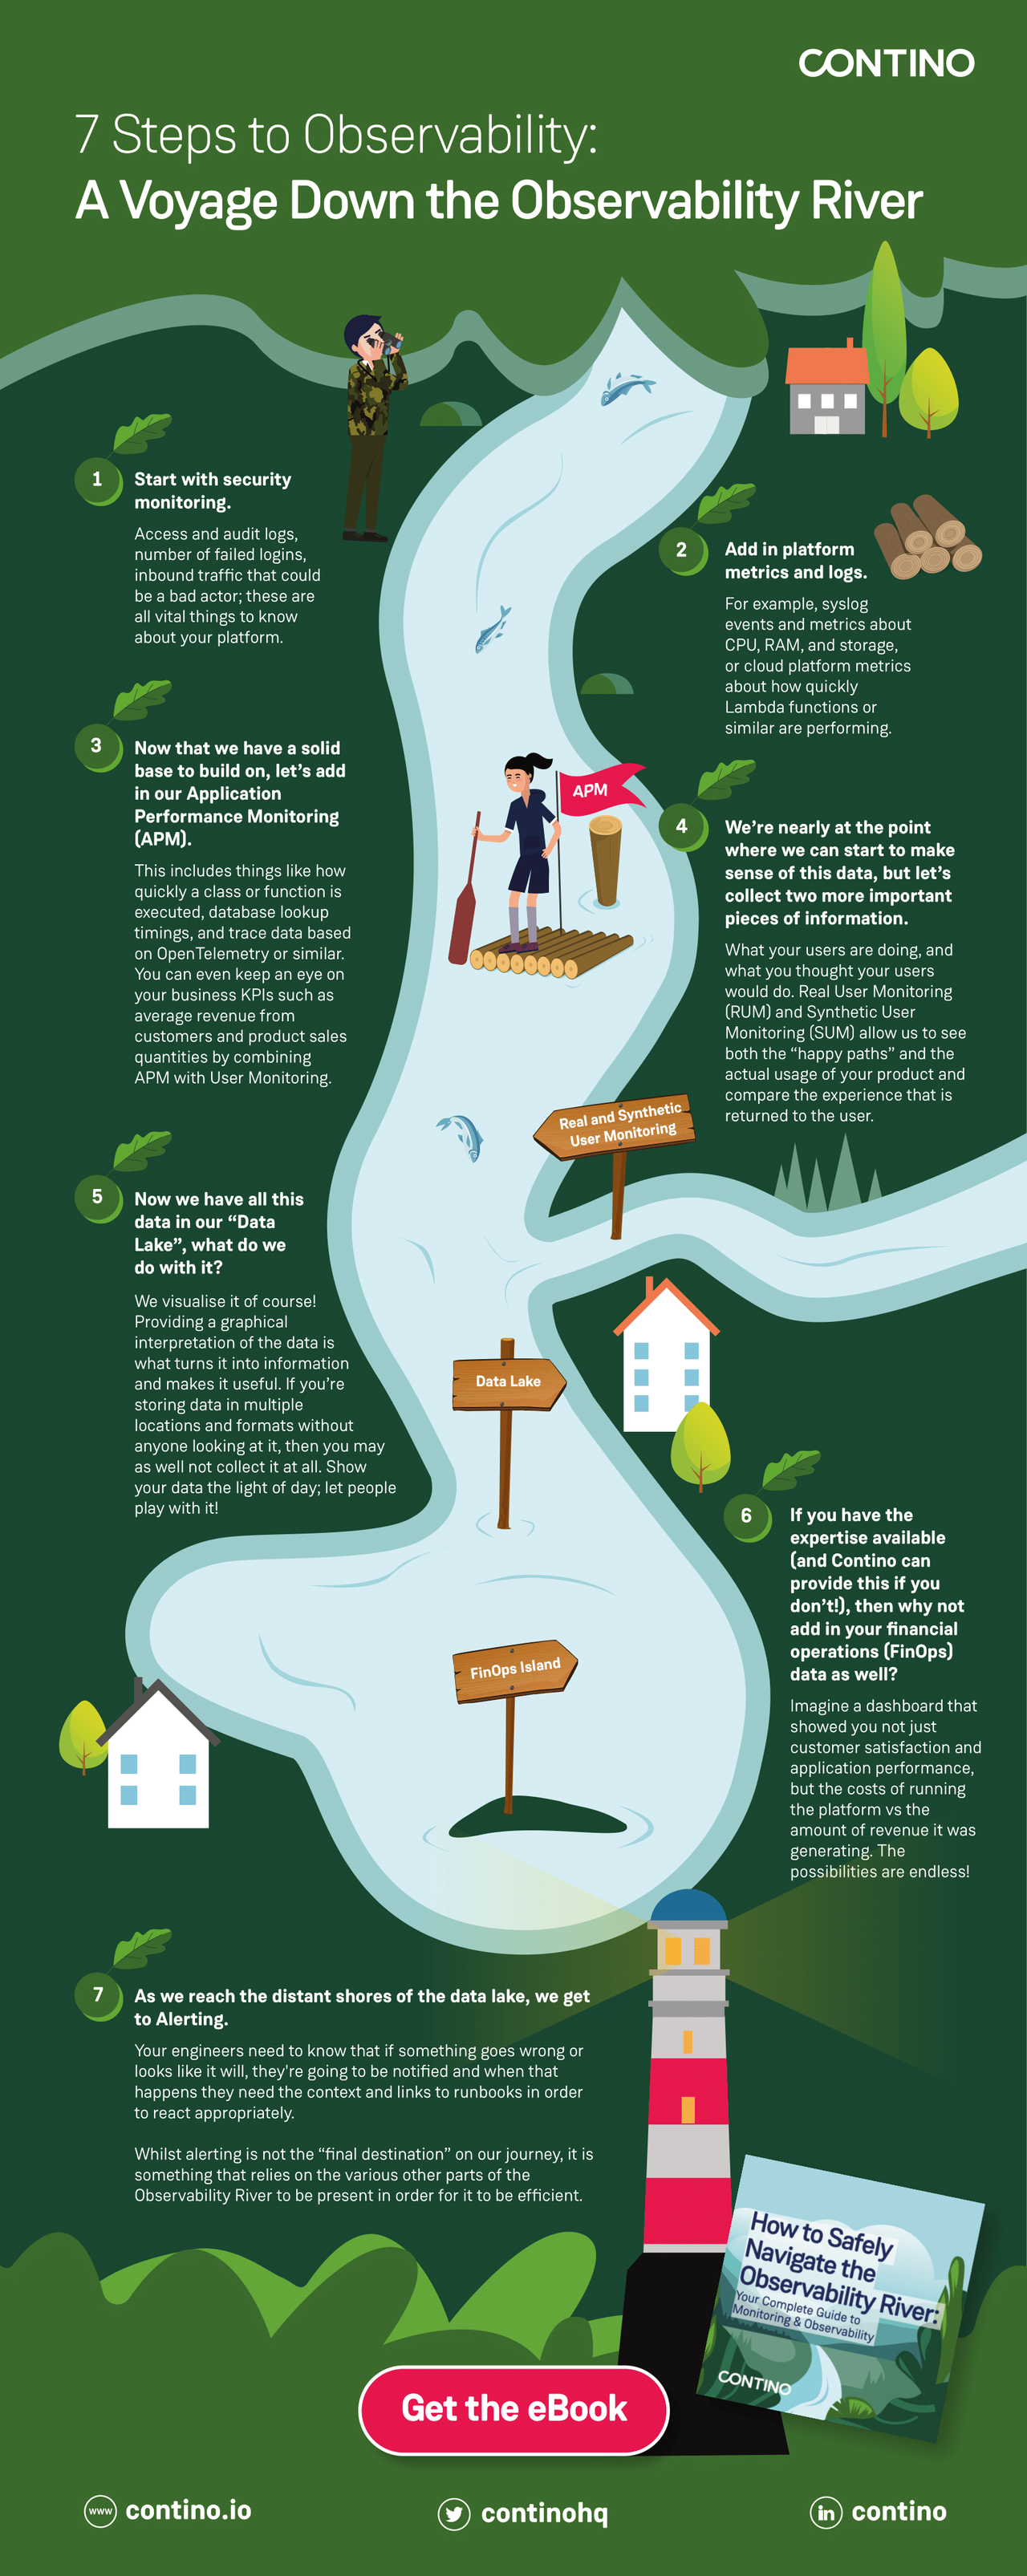
[Infographic] 7 Steps to Observability: A Voyage Down the Observability River
The complexity of software systems is ever increasing to meet growing customer demands.
Here are the 7 steps to observability you need to take to ensure your systems are operable, reliable and stable.
And make sure you download our eBook on all things observability to find out what it is, why you should be building monitoring into everything you do, what we mean by the “Observability River”, as well as all the tools you need to get started on your observability journey!
1. Start With Security Monitoring
Access and audit logs, number of failed logins, inbound traffic that could be a bad actor; these are all vital things to know about your platform.
2. Add in Platform Metrics and Logs
For example, syslog events and metrics about CPU, RAM, and storage, or cloud platform metrics about how quickly Lambda functions or similar are performing.
3. Add in Application Performance Monitoring (APM)
This includes things like how quickly a class or function is executed, database lookup timings, and trace data based on OpenTelemetry or similar. You can even keep an eye on your business KPIs such as average revenue from customers and product sales quantities by combining APM with User Monitoring.
4. Find Out More About Your Users
What your users are doing, and what you thought your users would do. Real User Monitoring (RUM) and Synthetic User Monitoring (SUM) allow us to see both the “happy paths” and the actual usage of your product and compare the experience that is returned to the user.
5. Visualise Your Data
Providing a graphical interpretation of the data is what turns it into information and makes it useful. If you’re storing data in multiple locations and formats without anyone looking at it, then you may as well not collect it at all. Show your data the light of day; let people play with it!
6. Add in Your Financial Operations (FinOps) Data
Imagine a dashboard that showed you not just customer satisfaction and application performance, but the costs of running the platform vs the amount of revenue it was generating. The possibilities are endless! If you need help with your FinOps data then feel free to get in touch with Contino!
7. Set Up Alerting
Your engineers need to know that if something goes wrong or looks like it will, they're going to be notified and when that happens they need the context and links to runbooks in order to react appropriately.
Whilst alerting is not the “final destination” on our journey, it is something that relies on the various other parts of the Observability River to be present in order for it to be efficient.
If you need help with your observability journey, get in touch!
To find out more about observability you can read the full eBook here!


